Baltimore's Housing Market Typology
This map of Baltimore’s Housing Market Typology was produced for Lab 1 in GES 687 during the Fall 2018 semester at UMBC.
Resources Used
This map was produced in QGIS 3.2.2-Bonn. The data was provided by Prof. Mahmoudi in the form of a shapefile of Census block groups in the City of Baltimore coded with the Baltimore Housing Market Typology classifications from 2014, along with a feature containing the boundaries of surface water within the city.
Since standard Census block groups include water as well as land area, the surface water feature overlapped a number of the Census tracts.
Baltimore City Boundary
The drop shadow around the borders of Baltimore City was produced using a shapefile of the city boundary supplied by the City of Baltimore Open GIS Data Site.
Because a few portions of the housing typology shapefile—in particular, the water feature—extended beyond the borders of the boundary shapefile, the boundary shapefile was used twice: first to create an opaque mask to cut off these extensions, and then to create a shapeburst fill drop shadow.
Background Map
The background street grid for the Baltimore area is shown via Stamen’s free Stamen Toner presentation of Open Street Map data.
Unfortunately, the Stamen Toner background is non-optimal, as it uses shading to display some features, which can interfere with reading the color-coding on the map. The Stamen Toner Hybrid map seems like it would work better for this purpose, since it lacks the shading, but it does not seem to be available online as XYZ Tileing.
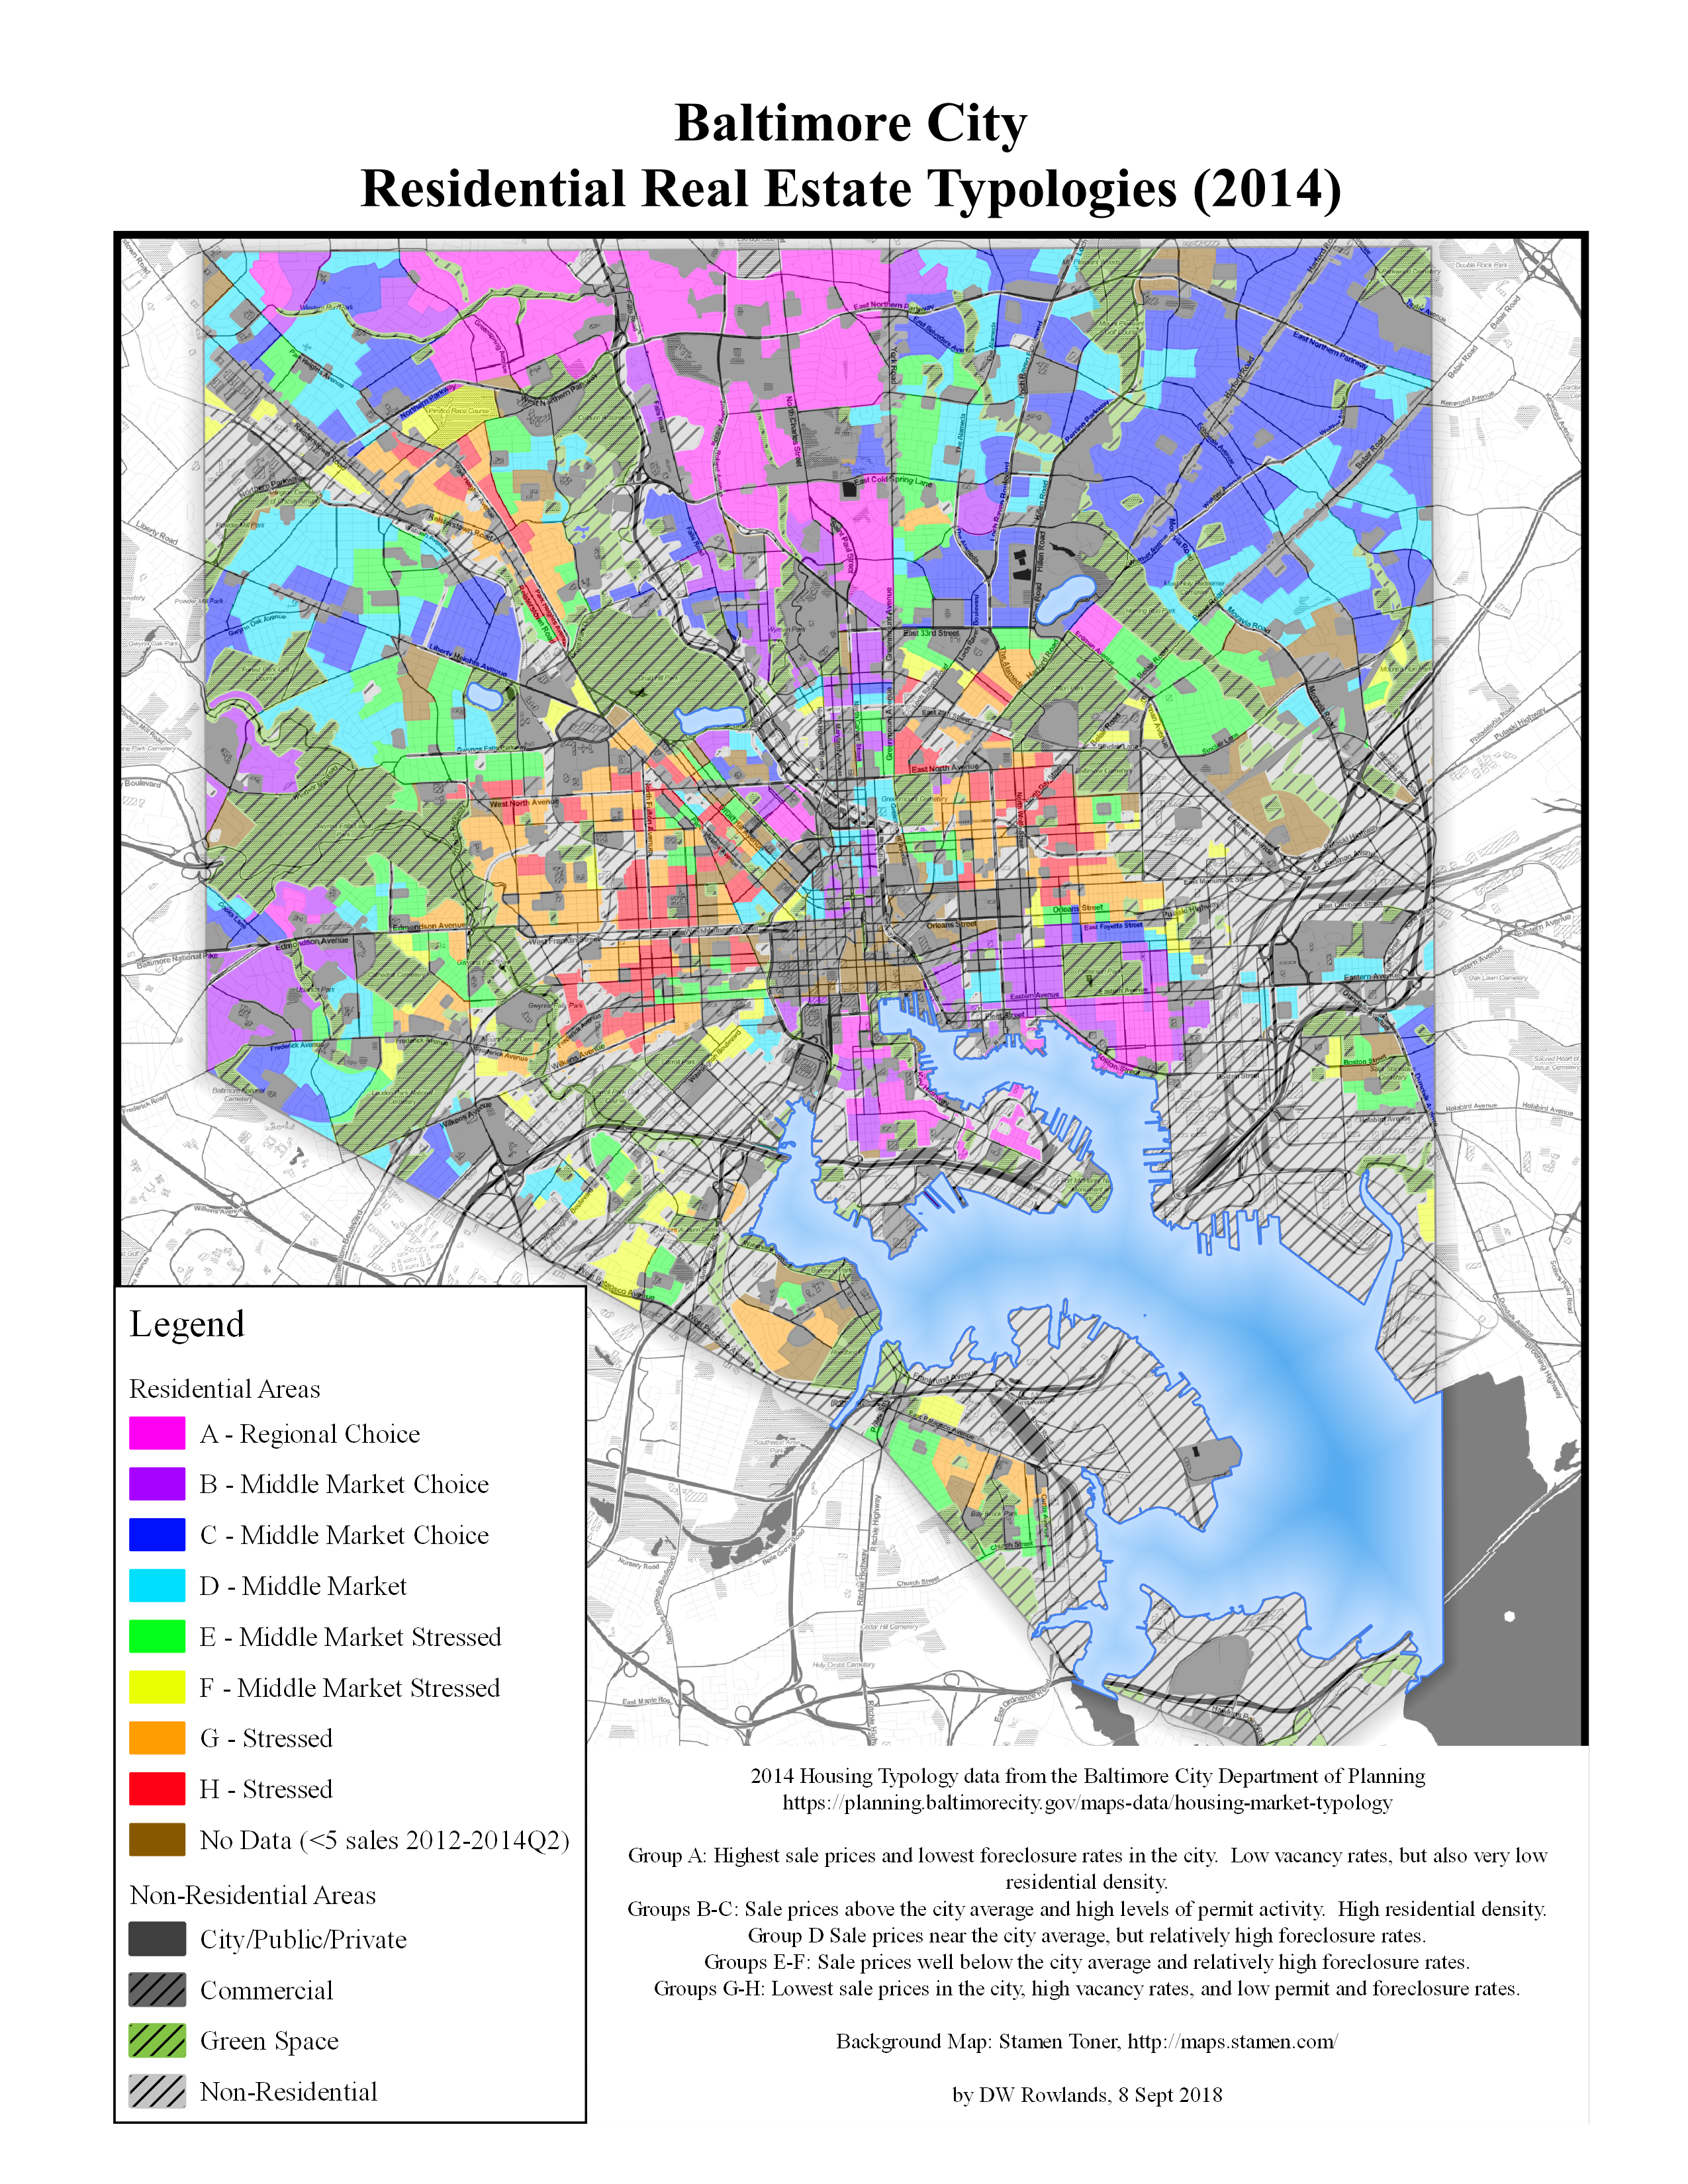
About the Baltimore Housing Market Typology
Baltimore’s housing typology is a project of the Baltimore City Department of Planning, the city Department of Housing & Community Development, and the city Reinvestment Fund intended “to assist the City in its efforts to strategically match available public resources to neighborhood housing market conditions.”
How Housing Types are Classified
The typology classifies Census block groups based on quantitative data about their housing markets, including sale prices, vacancy rates, foreclosure rates, percent of housing occupied by owner, residential densities, and the rates of new permits for housing contruction and renovation.
The exact classifications used in each version of the typology—versions based on recent data have been released every three years, in 2011, 2014, and 2017—differ, as they are determined statistically via cluster analysis, a technique for finding “natural” groupings of data points. In this case, the analysis is performed on eight variables relating to the residential housing market for each Census block group in the city.
How this Data is Used
The City of Baltimore uses the Housing Typology both to guide ongoing programs by the Department of Housing, and for longer-term planning by a number of city departments and non-profit groups.
The Housing Department’s code enforcement operations, including demolitions of vacant or blighted structures, are tailored based on the market cluster of the neighborhoods in which they are located. The typology is also used to coordinate the department’s Vacants to Values program to combat the city’s problems with vacant housing.
About the 2014 Version of the Housing Market Typology
The 2014 version of the Baltimore Housing Market Typology divides residential Census block groups into eight clusters, labeled A through H, which are in turn divided into five groups: “Regional Choice,” “Middle Market Choice,” “Middle Market,” “Middle Market Stressed,” and “Stressed.”
Unfortunately, the information about these groups available online is limited. However, the descriptions available for the 2017 typology suggest that the groups have roughly the following properties:
- Regional Choice: Highest sale prices and lowest foreclosure rates in the city. Low vacancy rates and very low residential density.
- Middle Market Choice: Sale prices above the city average and high levels of permit activity and residential density.
- Middle Market: Sale prices near the city average, but relatively high foreclosure rates.
- Middle Market Stressed: Sale prices well below the city average and relatively high foreclosure rates.
- Stressed: Lowest sale prices in the city and high vacancy rates, but low permit and foreclosure rates.
Non-residential Census block groups are divided into several distinct categories, including green space, industrial, commercial, and publicly owned. In addition, residential block groups with less than five sales between 2012 and the second quarter of 2014 are not classified, due to insufficient data.