GES 687 Portfolio
 My name is DW Rowlands. I am a visiting lecturer in chemistry at the University of Maryland, Baltimore County and I write about urban planning, transportation, and local history topics for Greater Greater Washington.
This site is a portfolio of projects I’ve created for GES 687, “Advanced Applications of Geographic Information Systems,” at UMBC.
Mapping Job Density and Commutes
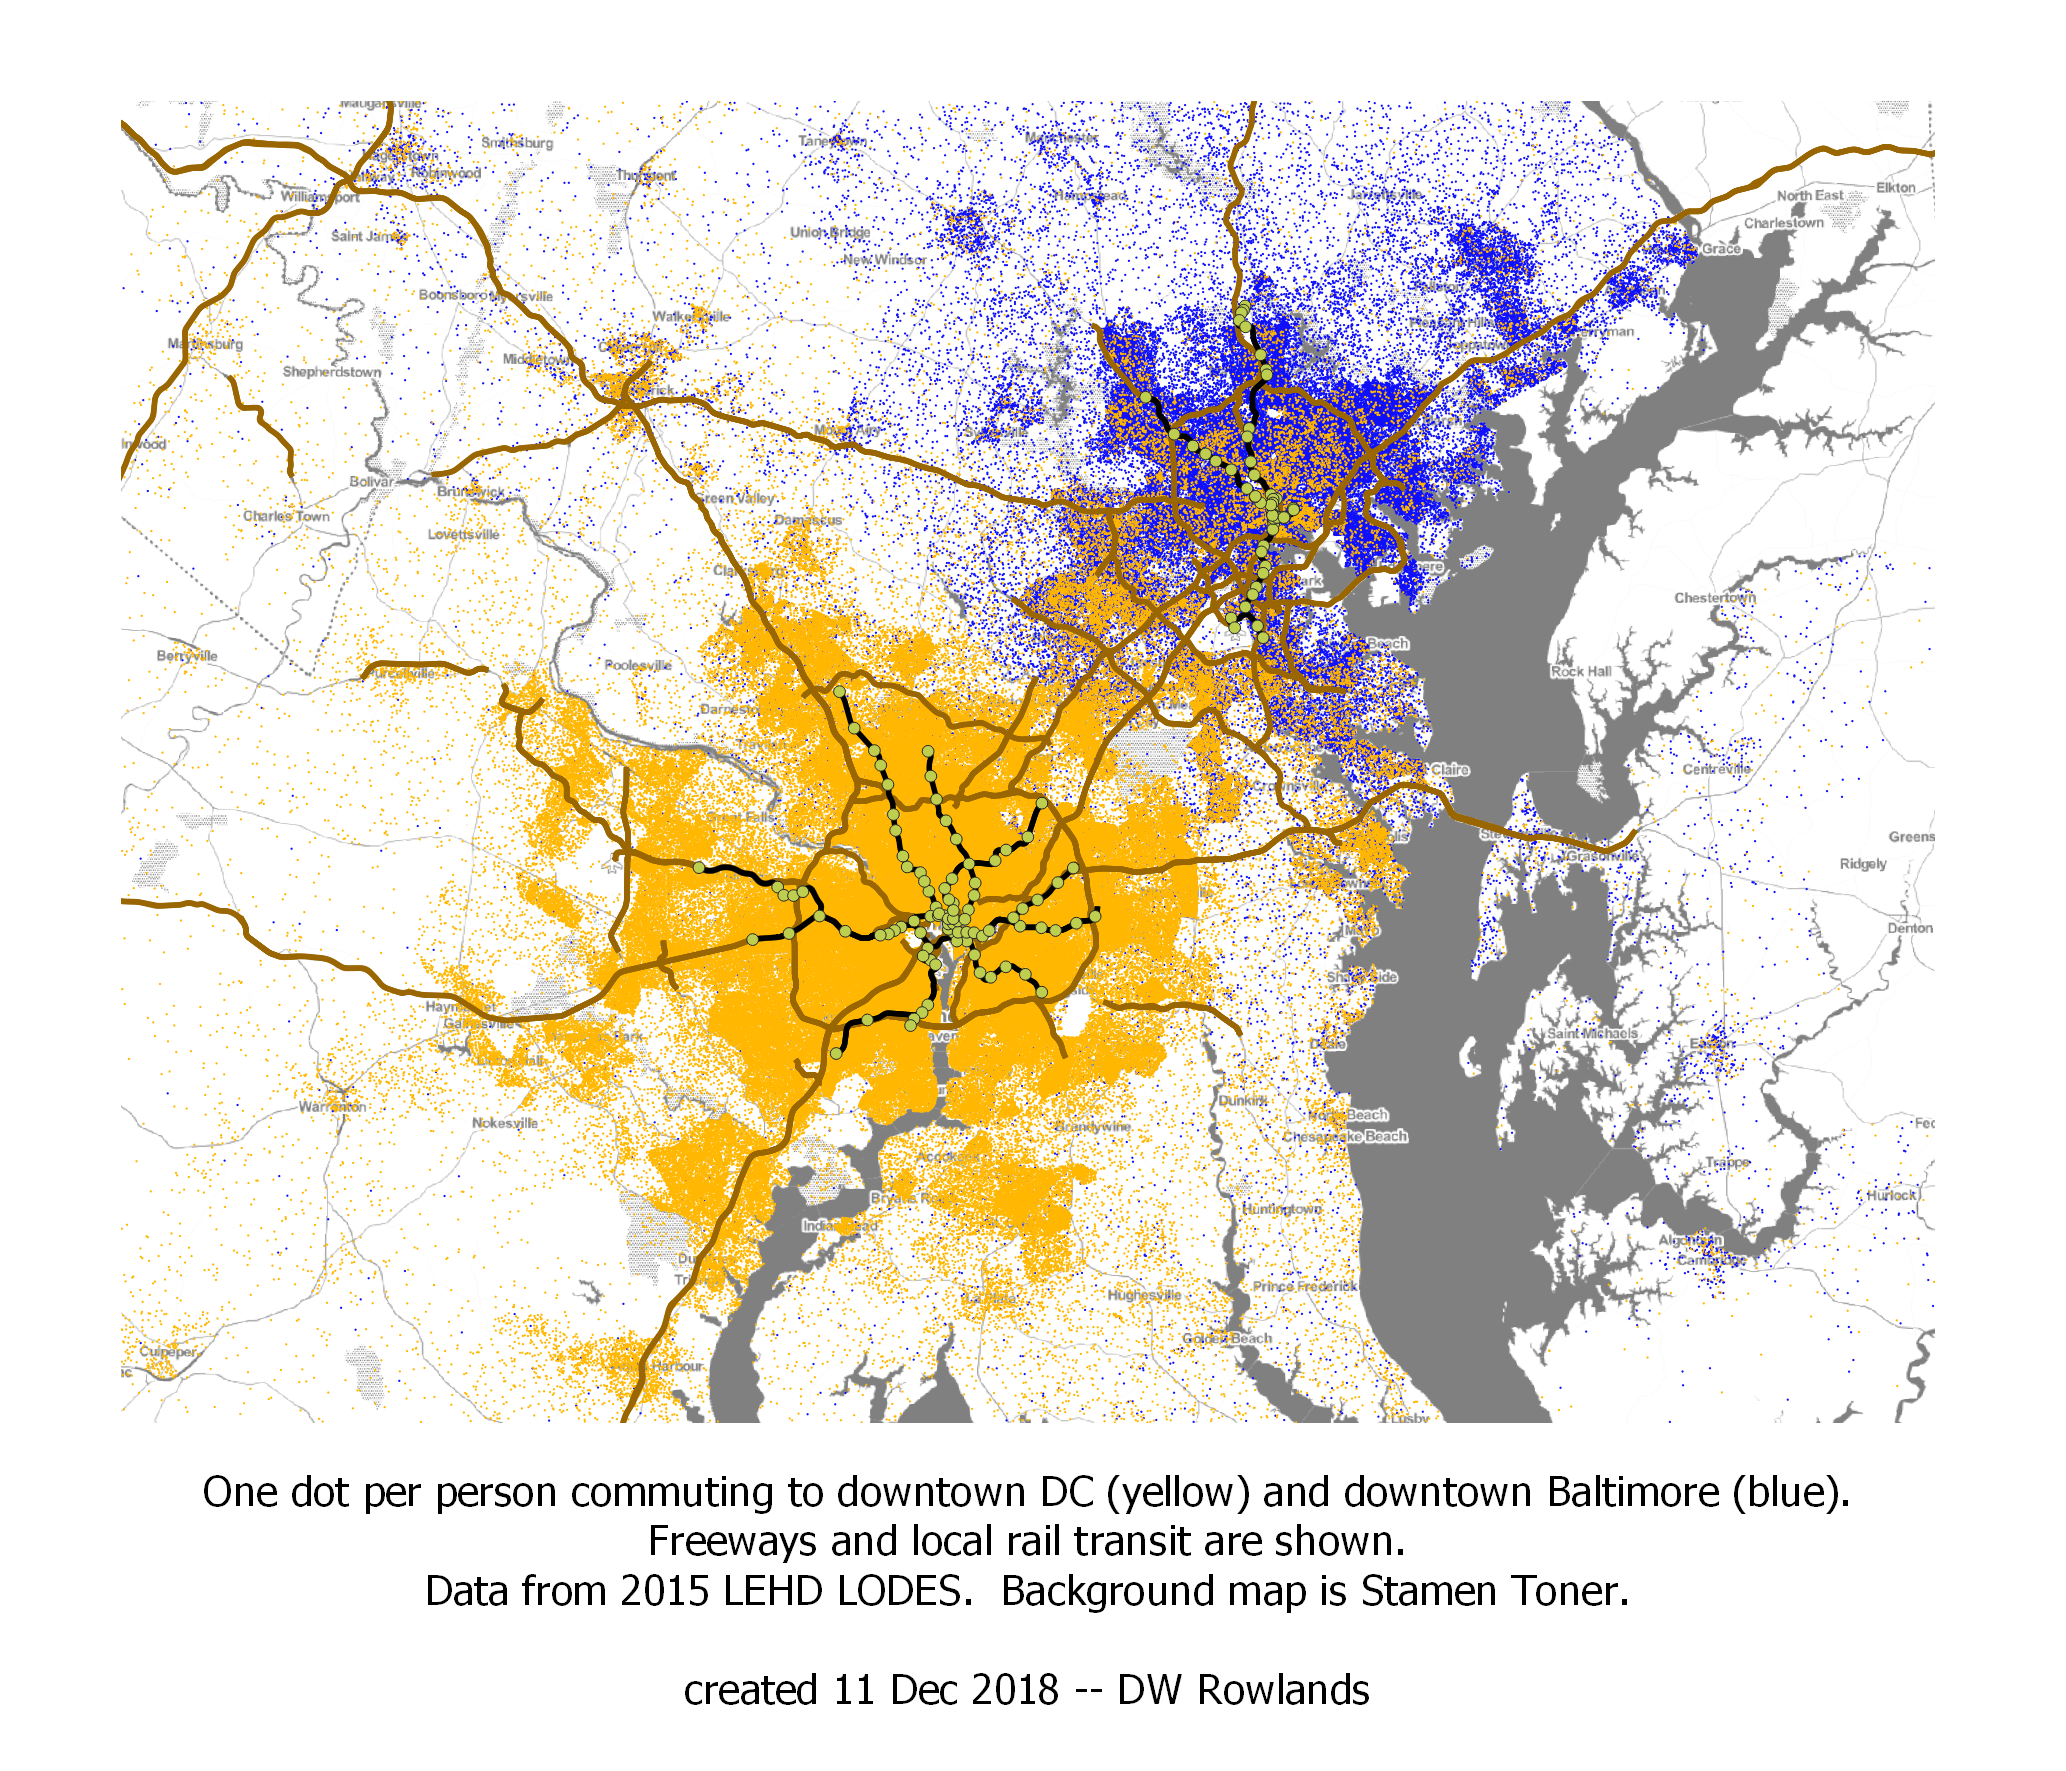
For my final project in GES 687, I worked on a dataset I’d wanted to make use of for years, but hadn’t had the skills to work with until I took the class: the Census’s Longitudinal Employer-Housing Dynamics program’s LEHD Origin-Destination Employment Statistics (LODES), which provides data on the workplaces and residences of most workers employed in the US. I focused on analyzing data from the Washington-Baltimore-Arlington Combined Statistical Area (CSA), one of the country’s largest, with nearly ten million residents and two major component metropolitan areas.
Race, Poverty, and Gender Ratios in Baltimore
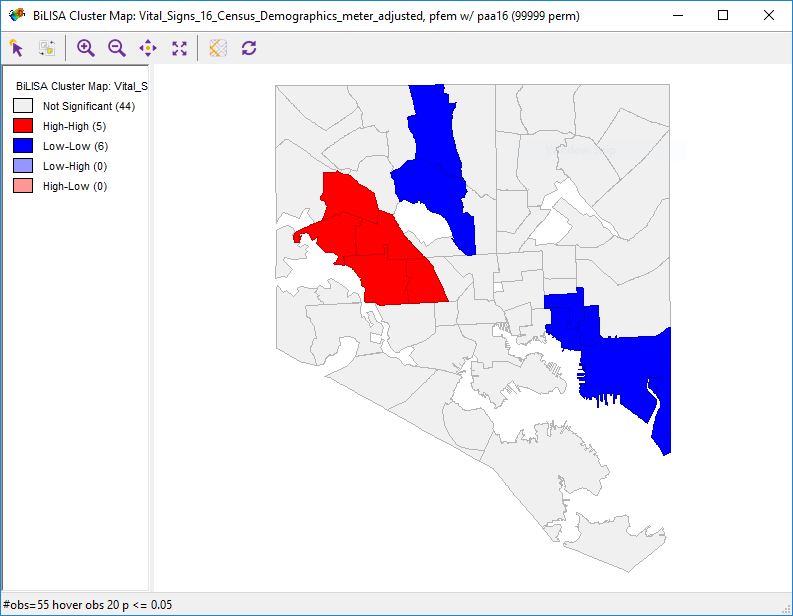 A bivariate local Moran’s I spatial correlation analysis map showing the high correlation between the fraction of African-American residents in neighborhoods and the fraction of female residents (a proxy for rates of incarceration of residents) in those same neighborhoods. It was produced for Lab 6 in GES 687 during the Fall 2018 semester at UMBC.
Population Distribution and Race
 Map of the population distribution in the DC metro area, 1970-2016. One dot per ten residents, colored blue for whites, green for African-Americans, orange for Latinx, and red for Asian-Americans (and others). The large dots are the center-of-population for each racial group within the study region. It was produced for Project 2 in GES 687 during the Fall 2018 semester at UMBC.
Property Values and Transit
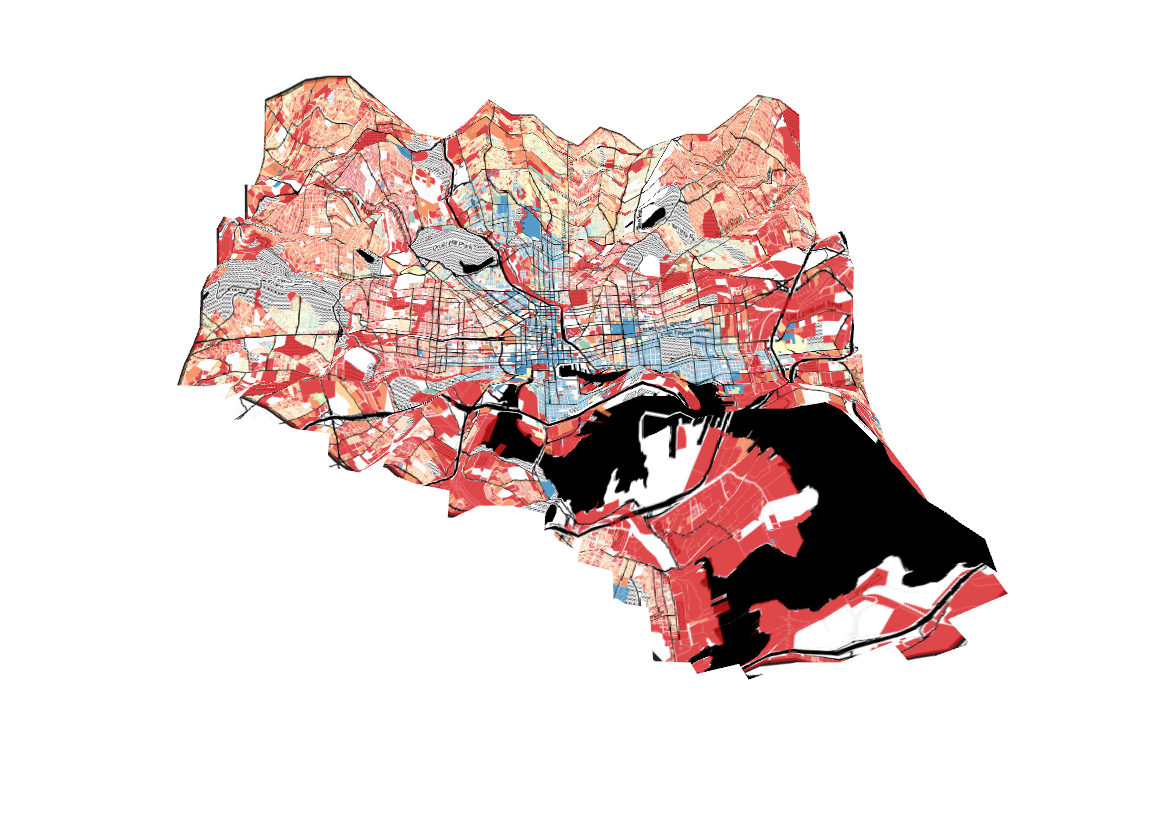 This 3D map of of Baltimore City shows distance from transit as elevation and value per square meter of private real property as color, with bluer colors indicating higher values. It was produced for Project 1 in GES 687 during the Fall 2018 semester at UMBC.
Baltimore Housing Market Typology
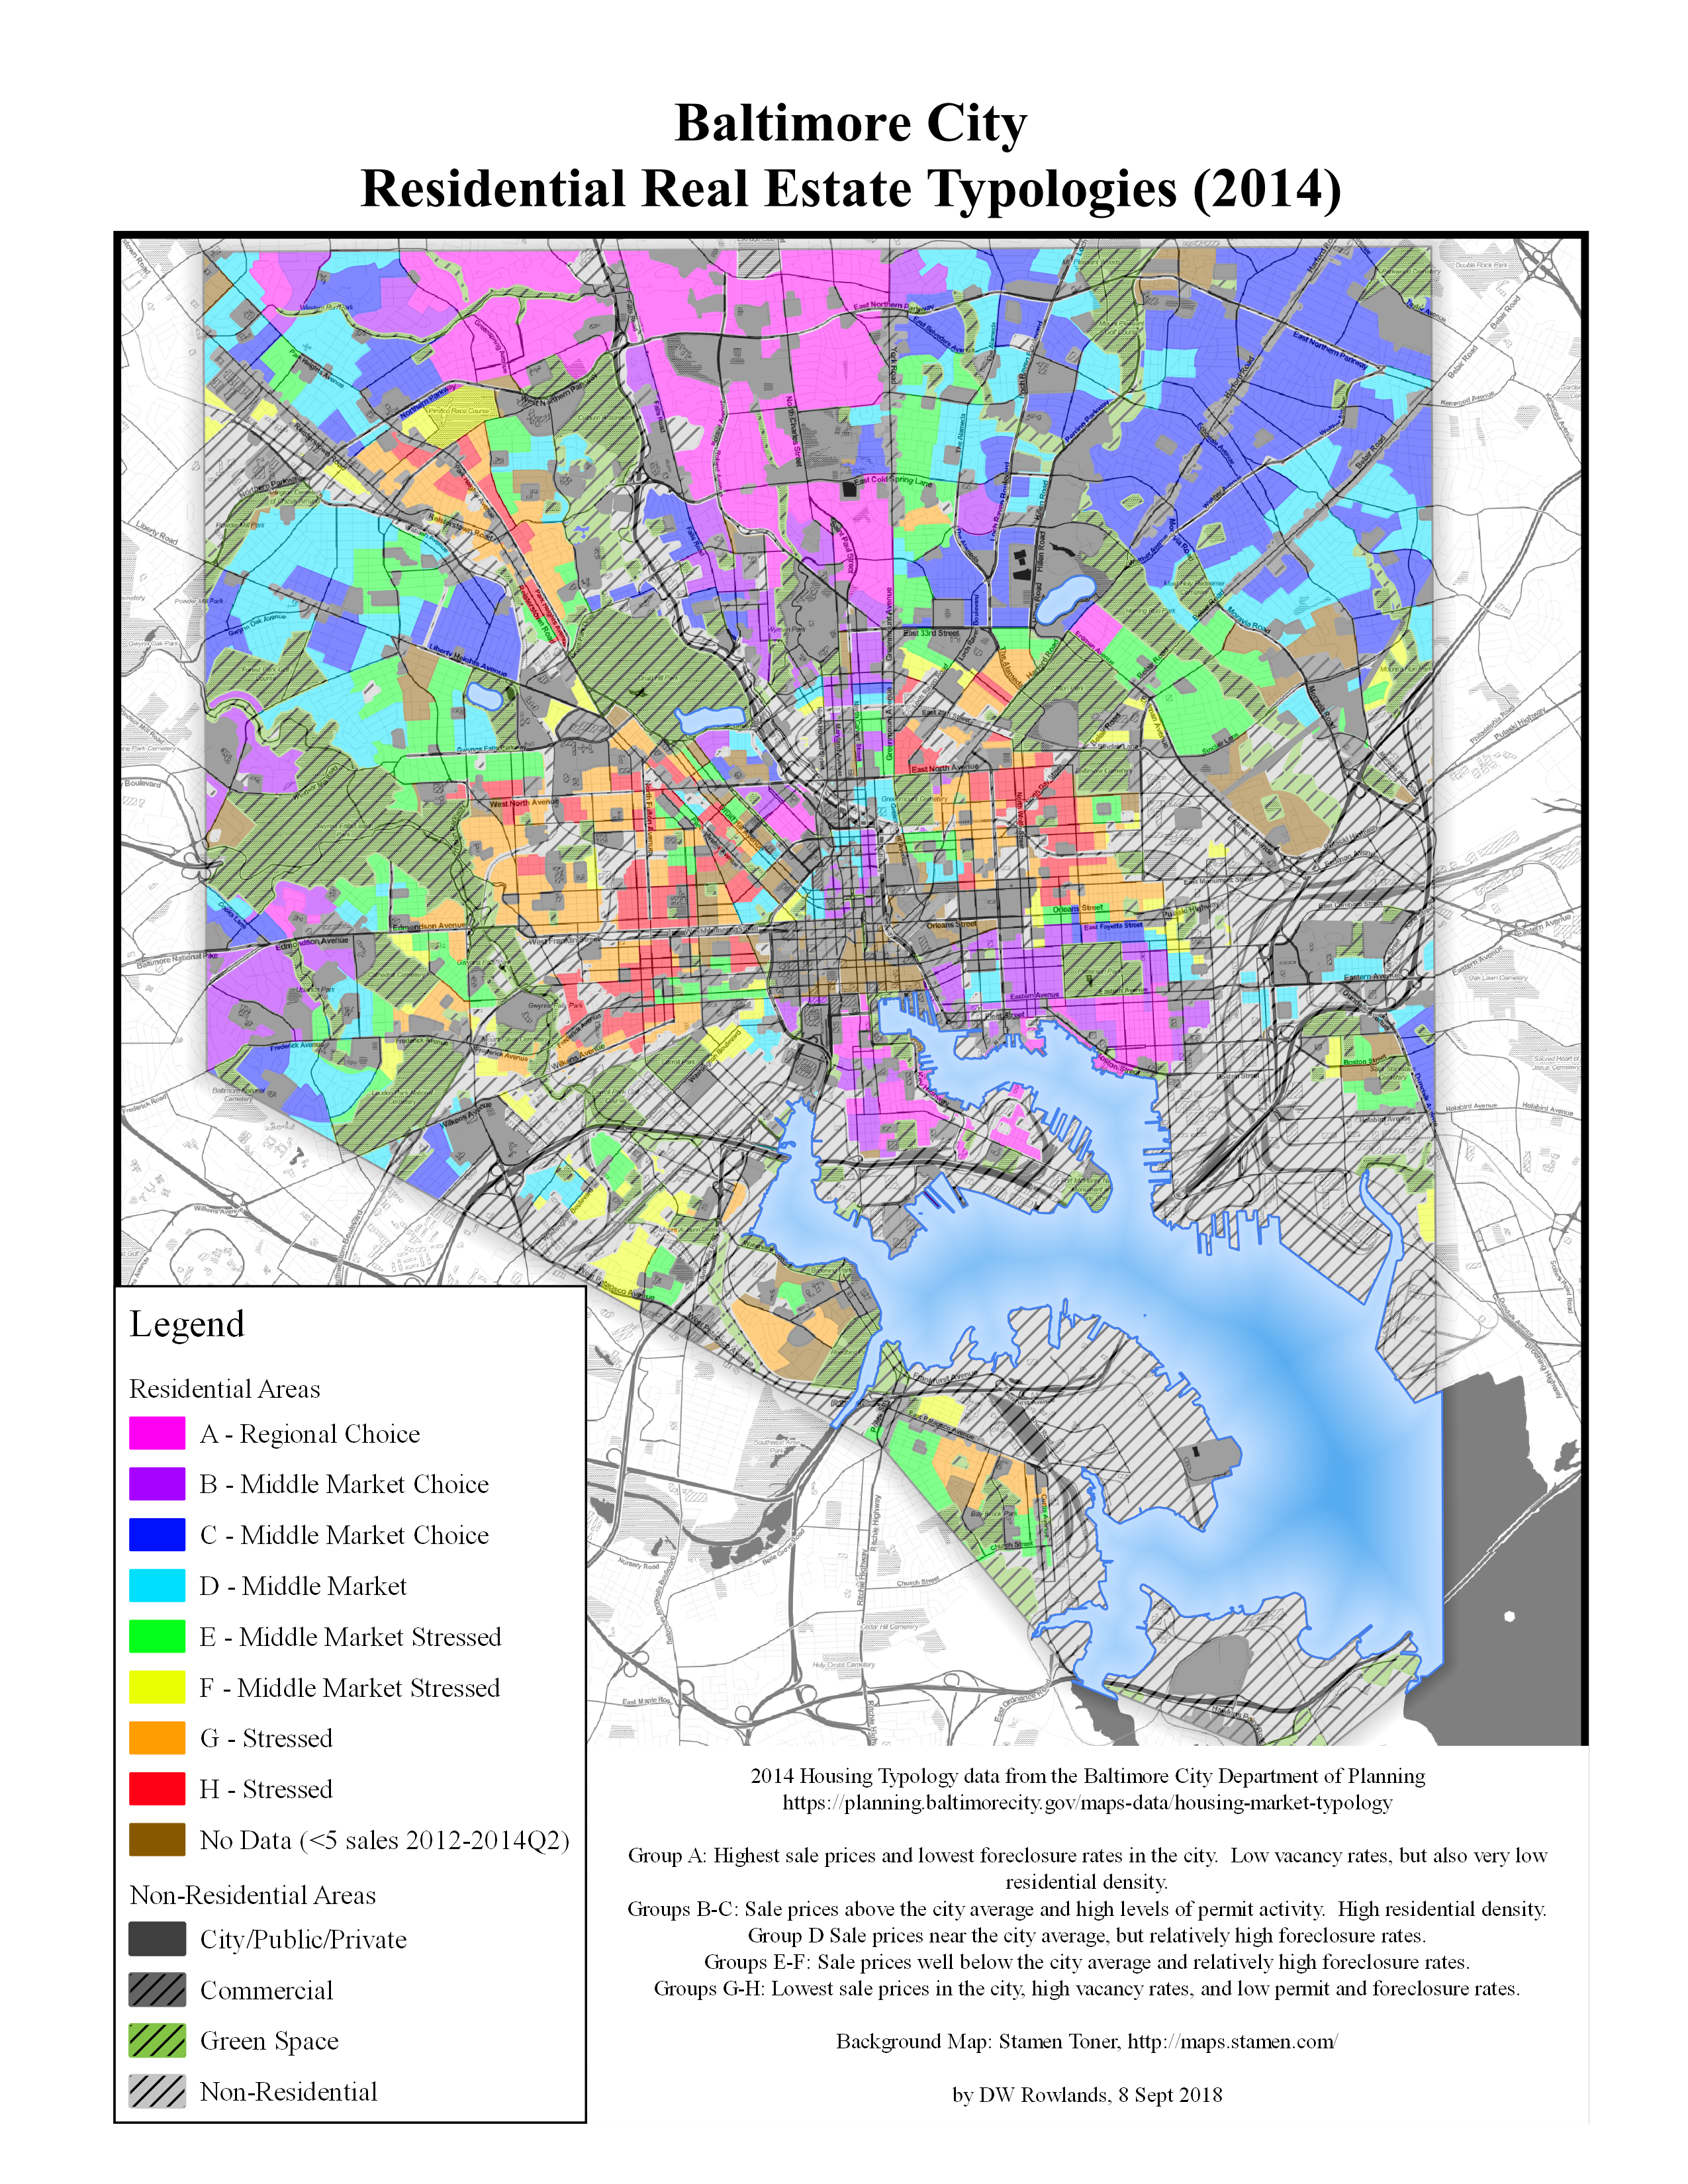 This map of Baltimore’s Housing Market Typology shows real property in Baltimore color-coded by use and market conditions. It was produced for Lab 1 in GES 687 during the Fall 2018 semester at UMBC.
Baltimore’s housing typology is a project of the Baltimore City Department of Planning, the city Department of Housing & Community Development, and the city Reinvestment Fund intended “to assist the City in its efforts to strategically match available public resources to neighborhood housing market conditions.”
DC-area Place Names
 I made this map of Census-designated places and municipalities in the DC area for a Greater Greater Washington article in June 2017.